What Does a Very Large-Scale Conversation Look Like?
Warren Sack uses The Conversation Map, a "graphical interface" that analyzes newsgroups and listservs, to analyze the possibilities of discourse analysis itself.
Introduction
The new electronic spaces that I am interested in have the following characteristics in common:
They are large. Many sites now support interchanges between hundreds and thousands of people. Usenet newsgroups and large listservs are the most common of such sites. I call these usually text-based, usually asynchronous interchanges, very large-scale conversations. (Sack 2000c)
They are network-based. More specifically, they support network-based communities. The boundaries of these spaces and the communites they support are not geographic boundaries. Communities of artists, writers, and scientists are examples of pre-internet, network-based communities; i.e., communities based upon a social network and some shared interests or needs. Network-based communities are of a different kind than geographically based communities such as neighborhoods, cities, and nations. Network-based communities — e.g., the scientific community — have continued to grow with the help of new network technologies, but contemporary technologies have also engendered a variety of new communities; e.g., the open-source community.
They are public. As more and more people gain access to the internet from their home or school rather than from their workplace, the internet increasingly becomes a space for public discussion and exchange. While very large-scale conversations are a common event within the confines of large industry (e.g., the huge number of communications between thousands of people necessary to design and build an airplane or coordinate the production of a film), these have a distinctly different character than the very large-scale conversations in which people are participating as individuals rather than as employees. The internet is engendering the production of new public spaces that may offer the means to reinvigorate public discourse. (Tsagarousianou et al. 1998; Hague and Loader 1999)
On the one hand, these electronic spaces — these very large-scale, public conversations — are quite prosaic. Usenet newsgroups, large e-mail lists, and other places on the internet where large volumes of email are exchanged are all good examples of very large-scale conversation. On the other hand, from a different perspective — for example, from the perspective of the history of media — very large-scale conversation is an entirely new and mostly unexplored phenomenon. At no other point in history have we had a medium that supports many-to-many communications between hundreds or thousands of people. VLSC takes place across international borders, often on a daily or hourly basis. Unlike in older media — for instance, telephones — participants in these very large-scale conversations usually do not know the addresses of the others before the start of a conversation.
Reflection on the current social scientific theories and tools we have for understanding and investigating conversations and discourse — for example, the tools and techniques of discourse analysis (Schiffrin 1994) or conversation analysis (Hutchby and Wooffitt 1998) — makes it clear that existing analytic frameworks are inadequate to the task. Existing theories and techniques can handle the analysis of small-scale conversations — e.g., interactions between thirty or fewer people — but it is not a priori obvious how these existing methods can be scaled up to handle the huge, many-to-many interactions that have now become commonplace on the internet. So the challenge is this: how can theories and computational tools be built to help us understand and participate in these very large-scale conversations?
More specifically, the challenge can be posed as a problem from the perspective of a participant in one of these very large-scale conversations. If I want to participate in one of these huge discussions my problem is this: how can I listen to thousands of others; and conversely, how can my words be heard by the thousands of others who might be participating in the same conversation? Phrased as a design problem, the question becomes the following: what software can be designed to help participants navigate these new public spaces?
Navigation
Lucy Suchman (1987, citing Gladwin and Berreman) has described how the activity of navigation can be conceived of as a very different practice in different cultures. To illustrate this, she compares the navigation activities of European sailors — which are said to be more plan-directed — with those of the Trukese — whose navigation appears to be more contingent upon an objective rather than a plan. In its current forms, VLSC is usually an intercultural phenomenon since it is usually conducted on the internet between participants from many different countries. To theorize and to design software to browse and navigate VLSCs it is necessary to make explicit the culturally specific assumptions that go into the design work.
Michel Foucault has pointed out that “the comparison between medicine and navigation is a very traditional one (Foucault 2000). Medicine, navigation, and government have to do with guidance, control, and governance. Etymologically, the verb “navigate” comes from the combination of words navis (ship) and agere (to guide). Thus, in the current case of the navigation of a large, public, information space — like a large archive of Usenet newsgroups — the “ship” has been replaced by a self, and so the point of navigation is self-guidance or self-governance. From this perspective, the right to way to evaluate or critique a browser — or any other piece of navigation software — is with respect to how well it supports self-governance. In the particular case of a VLSC browser it should help us better understand where we are located in a wider network of social and semantic relations. It should also help us consider the existence of a collective, self-organization constructed through the text and talk of a VLSC. I am interested in the larger ethical and philosophical implications of this understanding of navigation.
To better understand the issues of designing software for navigation, I’ve borrowed a conceptual framework from Paul Dourish and Matthew Chalmers who, in 1994, wrote a paper entitled “Running Out of Space: Models of Information Navigation.” In their paper, Dourish and Chalmers assert that there are at least three ways in which large bodies of information can be navigated: socially, semantically, and spatially. I would like to explain my reading of their paper to clarify my position.
Social Navigation First, Dourish and Chalmers claim that software can be designed to support the social navigation of information (Munro, Hook, and Benyon 1999). By social navigation, I understand them to mean, essentially, people helping other people to find information. Examples of social navigation software include the mechanisms employed in recommender systems and collaborative filtering (Resnick and Varian 1997). I believe that work done in organizing texts through citation analysis — as is done in the field of science studies — can also be counted as support for social navigation. (Garfield 1979)
Semantic Navigation By semantic navigation, I understand Dourish and Chalmers to mean the sorts of computation we have available to us when we use a search engine on the web. Using techniques from information retrieval and computational linguistics, semantic navigation can be supported through the calculation of some approximation to the meaning of a set of documents.
Spatial Navigation And, finally, by spatial navigation, I understand them to mean the sorts of manipulations often performed in the area of information visualization to convert a large body of data into a two- or three-dimensional image that can then be examined using a graphical interface of some sort. (Card, Mackinlay, and Shneiderman 1999)
My intention is to support all three of these types of information navigation for the domain of very large-scale conversations. My approach, generally speaking, is to use some techniques and tools from sociology to support social navigation; some ideas from linguistics to support semantic navigation; and some aspects of graphical interface design to support spatial navigation of VLSCs. More specifically, the part of sociology that I am interested in borrowing from and extending is that area known as social network analysis (Wasserman and Galaskiewicz 1994). Several researchers have employed the methods of social network analysis to the study of internet discourse (Smith 1997; Wellman 1999). The subdiscipline of linguistics that I want to use to support semantic navigation of VLSCs is computational, corpus-based linguistics. But, most specifically, what I am interested in is the use and improvement of automatic techniques for the compilation and augmentation of thesauri from large corpora of texts (Hearst 1998; Harabagiu and Moldovan 1999; Grefenstette 1994).
In these pages I am not going to say too much about techniques to support spatial navigation. A more complete description of my approach can be found elsewhere (Sack 2000a, 2000c). However, I will say that it is my goal to provide an interface that — at least in principle — can be used by all of the participants in an online discussion. Thus, graphical interfaces that can be presented as publicly accessible web pages is an important design criterion (and constraint) for me.
Conversation Map
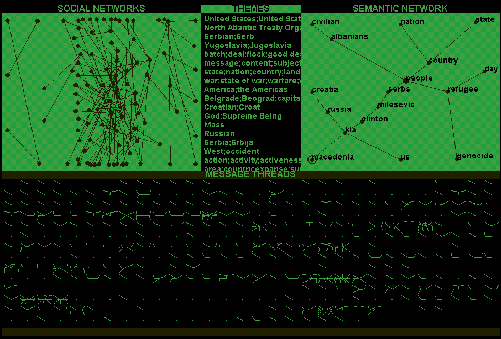 CAPTIONMARKERSTART17.1. The Conversation Map interface.CAPTIONMARKEREND
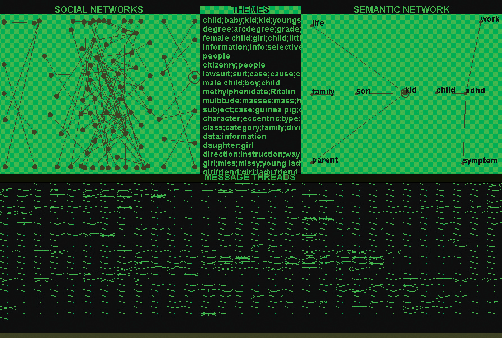
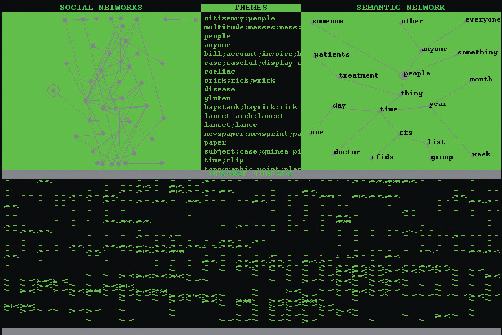
Figure 17.1 is a shot of the main screen of the Conversation Map system. The Conversation Map system accepts a corpus of several thousand messages and analyzes those messages using a set of computational linguistics and sociology techniques in order to generate a summary of the messages that includes who is talking with whom; the themes of discussion that are important to the conversation embodied in the messages; and (what can be understood as) some of the emergent definitions or metaphors of the discussion that are apparent if, in a certain sense, all of the participants’ language inscribed in the text — i.e., the content — of the e-mail messages are analyzed and “summed together.” In principle, one can use the Conversation Map in a manner akin to the usage of Netscape Messenger, RN, Eudora, or any other conventional news or mail reader. Right now, the text analysis procedures are too slow, but I am reengineering the system to support this usage in the near future. (A complete description of the text analysis procedures developed for the Conversation Map can be found in my thesis [Sack 2000c]; a shorter description of these procedures can also be found in a recent paper [Sack 2000b].) Figure 17.1 was generated by the Conversation Map system after it analyzed about 1,300 messages posted to the Usenet newsgroup soc.culture.Albanian in Spring 2000, during the war in Kosovo. It is a graphical summary of a large argument that engaged Albanians, Serbs, and others.
Social Networks The upper left quadrant of the interface depicts a set of social networks that record who — within the group of conversational participants — is reciprocating with whom. By “reciprocating” I mean who is mutually responding to and/or quoting from whom. Thus, if I were to post a message to the newsgroup and then you were to respond to it and then, later in the discussion, you were to post to the newsgroup and I replied to — or quoted from — your message, then the two of us would be — according to my definition — said to be reciprocating with one another. Reciprocation is an important property of smaller-scale discussions that has been explored by, for instance, researchers in the field of conversation analysis, and so I believe this may also be an important property of large-scale discussions.
As reciprocating participants of the discussion, you and I will appear as nodes in the graphs representing social networks, and a line will be drawn between us. If we reciprocate many times over the course of the conversation we will be plotted close together. In contrast, those pairs of participants who reciprocate only once will be plotted relatively far apart. Note that posters who spam the group with many messages, but who receive no replies, do not even show up on the graph. Those participants who show up closely connected are pushed to the middle of the graph and can be understood as virtual mediators of the newsgroup. I say participants in central positions of the social network are “virtual moderators” because most of the analyses I have done have been of unmoderated, public discussion spaces on the Net. To end up in such a position one needs not only to post many messages, but also to have others in the group reply to or quote from many of one’s messages. So, the social network display acts both as a filter for spammers and a means to identify some of the main players in a discussion.
“Themes” of Conversation The menu in the upper-middle of the interface lists the “themes” of the conversation. (I put “themes” in quotes because, according to the terms of linguistics, what is being calculated by the system is strictly speaking not the themes, but the lexical ties between messages; a necessary, but not sufficient, step in the determination of the themes of discussion.) Let’s say I post a message about football, and then you respond with a message that includes some reference to baseball. Then, perhaps later in the discussion, you post a message about skiing and I respond with one concerning skating. Our reciprocation will be represented in the social network, but some approximation to the theme of our exchange will also be listed in the menu of “themes.” In this case, because football, baseball, skiing, and skating are all sports, the term “sports” might be listed on the menu of themes. Calculating that these four terms are all sports requires, of course, a machine-readable thesaurus. The thesaurus employed in the Conversation Map system is WordNet, a lexical resource created by George Miller, his colleagues, and students at Princeton University (Fellbaum 1998).
Semantic Network One way to understand the difference between the menu of themes and the graph depicted in the upper right-hand corner of the interface is this: while construction of the menu of themes requires the use of a predefined thesaurus, like WordNet, the calculations performed to create the semantic network in the upper right-hand corner do not use a thesaurus, but, rather, automatically generate a rough-draft thesaurus. To create a rough-draft thesaurus, the Conversation Map system does the following: first, the content of all of the messages exchanged during the conversation is parsed — i.e., subjects, verbs, objects and some other modifying relations are identified between the words of each sentence in the texts of the messages. Next, for each unique noun mentioned in the corpus of messages a profile is built. By “profile” I mean that, for each noun, a vector is created that records all of the verbs for which the subject functioned as a subject; all of the verbs for which the noun functioned as an object; all of the adjectives which modified the noun; etc. Once a profile has been calculated for each noun, the nouns’ profiles are compared to one another and each noun’s nearest neighbor is identified. An algorithm described by Grefenstette is used to calculate and compare the noun profiles. If two nouns are nearest neighbors then, according to this calculation, they appear in similar contexts. Or, to put it more plainly, if two nouns have similar profiles, then they can be said to have been “talked about” in similar ways by the participants in the discussion. On the semantic network, if two nouns are nearest neighbors, then they are plotted as two nodes connected to one another.
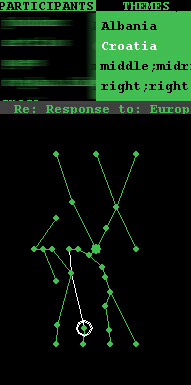 CAPTIONMARKERSTART17.2. An example message thread.CAPTIONMARKEREND
Why, one might ask, is this sort of analysis of interest for the navigation of very large-scale conversations? To answer this question, I compare this sort of analysis with some work done by the cognitive scientists George Lakoff and Mark Johnson (1980). Lakoff and Johnson wrote a book entitled Metaphors We Live By. The book is filled with a set of metaphors that Lakoff and Johnson claim are central to our culture. In this book, for instance, they claim that one emergent metaphor of our culture is that “arguments are buildings.” As part of their method to argue for the validity of insights like this, they show how two nouns, which might a priori be considered to be completely unalike one another — such as the two terms “argument” and “building” — show up in very similar contexts. For example, one can say, “The building is shaky,” but one can also say, “The argument is shaky.” One can say, “The building collapsed,” but also, “The argument collapsed.” Similarly, both buildings and arguments can be said to have “foundations,” “to stand” and “to fall,” “to be constructed,” “to be supported,” “to be buttressed,” and so forth. A set of similar sentences of this sort provides an empirical means for thinking about and discovering how definitions and metaphors are produced over the course of a large amount of discussion. Thus, this tool for automatic, rough-draft thesaurus generation can be seen as “training wheels” to allow us, within the context of a specific conversation, to begin to generate the sorts of hypotheses that Lakoff and Johnson explore in their book. So, the Conversation Map gives one some data exploration/navigation tools to start to understand how different conversations differ from one another according to the metaphors and definitions that are produced by the collective efforts of their participants.
Message Archive The lower half of the interface is a graphical representation of all of the messages that have been parsed and analyzed by the Conversation Map system. Messages are organized into threads where a thread is simply defined as an initial post, all of the responses to the initial post, all of the responses to responses, etc. The threads are organized in chronological order from upper left to lower right. The lower half of the screen is divided into a grid and so the first thread posted to the newsgroup appears in the upper left-hand corner and the last thread posted appears in the lower right-hand corner. The specific shapes of the plotted threads will not be explained here. The interested reader can find an explanation in another paper (Sack 2000b). Here, in this essay, I simply want to point out that — if a thread contains many messages — it shows up as an almost completely green square on this display. If a thread contains few messages, then it shows up as an almost completely black square. Thus, by reading across and down — from upper left to lower right — the lower half of the screen provides a rough guide to the posting activity in the newsgroup over the period of time spanned by the messages.
Examples
[ see sidebar for full size images — ed. ]
In the following section I show twelve example Conversation Maps that were generated from a wide variety of online public discussions. With these examples, I hope the semiotics of how to read these maps will become understandable. Also I hope that these one page, graphical summaries of hundreds or thousands of e-mail messages will be seen to be a useful thing for gaining a quick glimpse into a very large-scale conversation.
Politics
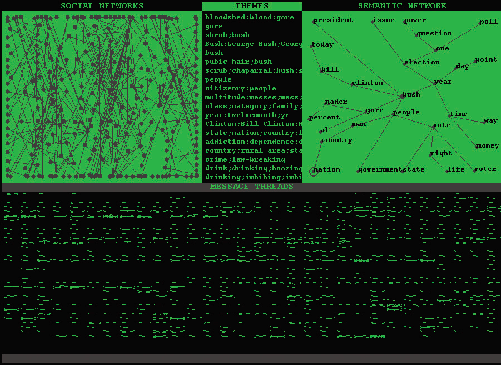 CAPTIONMARKERSTART17.3a. Before the election.CAPTIONMARKEREND
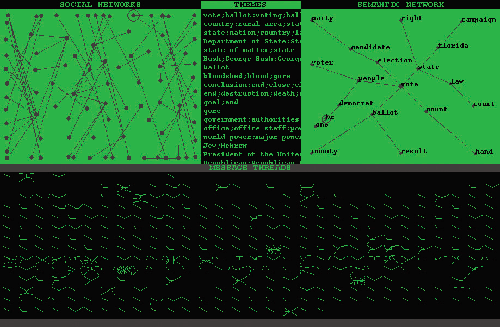
The map above and the map below were created about a week apart using messages from the newsgroup alt.politics elections. The map above (figure 17.3a) was generated immediately before the 2000 presidential election. Notice how the main themes of discussion center around the candidates: Gore, Bush, and Nader. A week after the election the conversation (as mapped below, 17.3b) has moved away from a discussion of the candidates. Now it is a discussion of the technicalities of elections: votes, counts, ballots, laws, and courts are the newly prominent themes of discussion.
 CAPTIONMARKERSTART17.3b. After the election.CAPTIONMARKEREND
Media
 CAPTIONMARKERSTART17.4a. Talking to one another.CAPTIONMARKEREND
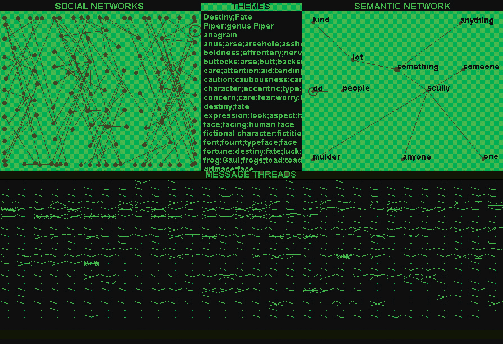
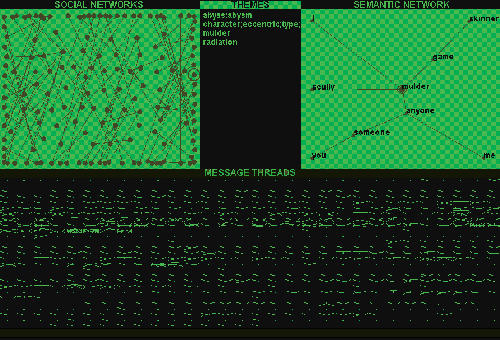
This pair of maps (17.4a, 17.4b) show the same newsgroup (a discussion about the television show The X-Files) at two different times. Notice how many themes of discussion there are in the map above. Now, notice how very few themes of discussion are listed in the map below. Because the Conversation Map uses a very generous means of counting the themes of dicussion, it usually lists too many, not too few. What this map tells us is that no one is following up on what other people are saying. The two snapshots in time represented by these two maps demonstrate how an online discussion can change from being one where people talk to one another into one where they just talk at one another. This fact is also represented in the very scattered appearance of the social network.
 CAPTIONMARKERSTART17.4b. Talking at one another.CAPTIONMARKEREND
Environment
 CAPTIONMARKERSTART17.5a. People as problems.CAPTIONMARKEREND
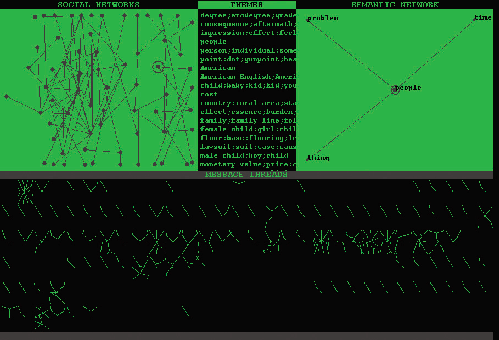
The map above (17.5a) represents about a month’s worth of messages posted to the group sci.environment. The map below (17.5b) represents the same newsgroup one month later. By comparing the two maps you can get some idea of how the group has changed over time. One thing that has remained stable between the two maps is the connection in the semantic networks between the terms “people” and “problem.” This is a clue that perhaps, in this newsgroup, people are seen to be one of the main causes of environmental problems. But a hypothesis like this that one can come up with by looking at the maps needs further investigation to be confirmed or discarded.
CAPTIONMARKERSTART17.5b. And, problems as people.CAPTIONMARKEREND
Education
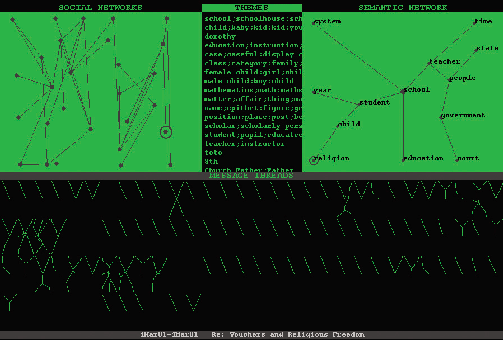 CAPTIONMARKERSTART17.6a. A shallow conversation.CAPTIONMARKEREND
Above (17.6a) is a map of about 300 messages from the Usenet newsgroup misc.education. Note the themes of discussion and compare them to the map on the right. Both maps summarize discussions about education and learning. The map below (17.6b) summarizes a semester’s worth of messages posted by a distance learning course taught by Prof. Linda Polin of Pepperdine University. In comparison with the first map, note how much more tightly knit the social network is here: people are responding to one another. Note also the elaborate threads containing many messages as compared to the sparse threads in the first map. These elaborate thread structures show that the participants are repeatedly elaborating on one another’s posting. This sort of an exchange is perhaps much deeper than, for example, the quick question-and-answer format of the technology discussions depicted below and the curt exchanges that one can note in the threads of the political discussions above.
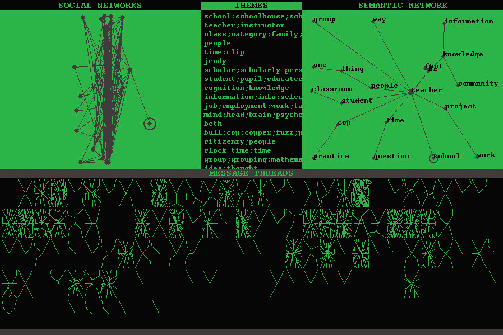 CAPTIONMARKERSTART17.6b. A deep conversation.CAPTIONMARKEREND
Technology
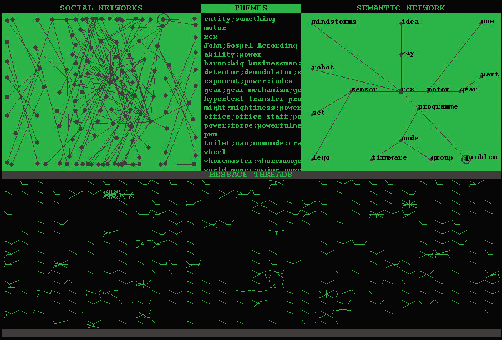 CAPTIONMARKERSTART17.7a. Experts as hubs in a social network.CAPTIONMARKEREND
The conversation map above (17.7a) was created from about a month’s worth of messages posted to a public listserv devoted to the construction of Lego robots. Note how the social network shows that there are multiple hubs: these correspond to an expert in mechanical systems, an expert in programming, and expert in electronics. The second map (17.7b) is an analysis of about 2500 messages from the newsgroup devoted to the Perl programming language: comp.lang.perl.misc. Note the dense social network and also compare the thread pattern here with the class-based, education conversation analyzed above. The pattern here is indicative of a series of brief question-answer clusters. The elaborate threads above indicate that participants are repeatedly elaborating on one another’s responses.
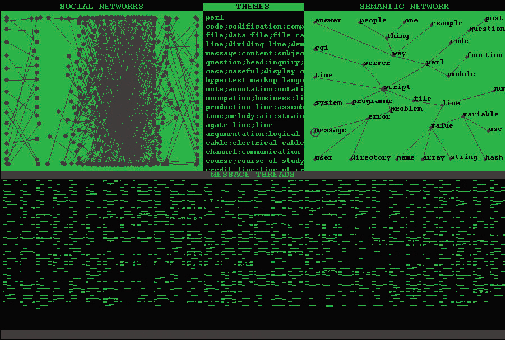 CAPTIONMARKERSTART17.7b. A pattern of question-answer pairs.CAPTIONMARKEREND
Health
 CAPTIONMARKERSTART17.8a. Illness and family relations.CAPTIONMARKEREND
The conversation depicted in figure 17.8, above (17.8a), took place in a public newsgroup devoted to attention-deficit disorder. However, one can see from the map that the discussion was not just about the illness, but about family members as well. The map below (17.8b) is summary of several hundred messages sent to a newsgroup on chronic-fatigue syndrome. As can be seen here too, the discussion focuses — not just on the illness — but on a more general discussion of people and citizenry. The anthropologist of science, Prof. Joseph Dumit of MIT, argues that illness like these (ADD and CFS) are illnesses one has to “fight to get” because they are often not recognized by doctors and insurance companies. Consequently, online discussions can become places where sufferers can meet and illness-based social movements can emerge.
 CAPTIONMARKERSTART17.8b. Illness and citizensCAPTIONMARKEREND
Conclusions
Individuals need a map of the group in order to find their current or desired position in the group. Groups need a map to reflect on their limits and internal structure. This map can be either a metaphorical or a literal map. Maps have historically been very important for geographically circumscribed groups. On a country’s map, citizens can find their homes, their proximity to the capital, their range of travel experience, and so forth. Maps usually incorporate several kinds of information; e.g., political boundaries, roads, and elevations might be included on one map of a region. No map can incorporate all kinds of information, but — at least for maps of physical geography — it seems clear that certain kinds of information are essential to all maps. For example, the map of a country needs to include some representation of the country’s borders. However, it is not clear what needs to be included in a map of a non-geographically-based group. What, for instance, does a member of a Usenet newsgroup need to see in order to navigate through the VLSC of the newsgroup?
A VLSC is a “space” created through the electronic exchange of words. A map of a VLSC depicts a sea of information in which participants sail through, make waves in, and sometimes beach themselves to become an island or even a continent. Since the map of a VLSC depends upon the words and deeds of the participants, a participant might use the map to navigate and by so navigating change the map. In this way map construction and navigation of VLSCs can be mutually recursive activities. One might imagine that this relationship between navigation and map-making is specific to information spaces, but in fact it takes only a quick glance at a world map of over ten years ago — before the end of the Cold War — to see that geographically based map-making is predicated on social and political forces and the boundaries of social and political forces are outlined on maps.
Participants in the emergent medium of VLSC will need new technologies to orient themselves in navigating through and interacting with these new public spaces. Moreover, the group of participants involved in a VLSC need a means to recognize themselves as a socially, politically, or economically (in)cohesive entity for purposes of self-governance. The Conversation Map system is an attempt to provide one effort One example among many. See also, for instance, Donath, “The xx of xx,” and Smith, “Netscan: Measuring and Mapping the Social Structures of Usenet.” towards building tools for community self-recognition and self-governance.
Sidebar
Responses
Phoebe Sengers responds Rebecca Ross responds Warren Sack responds
References
Agre, Phil (1997). “Toward a critical technical practice: Lessons learned in trying to reform AI.” In Social Science, Technical Systems and Cooperative Work: Beyond the Great Divide, edited by Geoffrey C. Bowker, Susan Leigh Star, William Turner, and Les Gasser. Mahwah, NJ: Erlbaum.
Anderson, Benedict (1983). Imagined Communities: Reflections on the Origin and Spread of Nationalism. London: Verso.
Berreman, Gerald (1966). “Anemic and Emetic Analyses in Social Anthropology.” American Anthropologist 68, no.2, part 1 (1966): 346-354.
Card, Stuart K., Jock D. Mackinlay and Ben Shneiderman (editors) (1999). Readings in Information Visualization: Using Vision to Think. San Francisco: Morgan Kaufmann Publishers.
Castells, Manuel (1996). The Rise of the Network Society: Economy, Society and Culture, Vol. I. Cambridge, MA: Blackwell.
DiBona, Chris, Sam Ockman and Mark Stone (editors) (1999). Open Sources: Voices from the Open Source Revolution. Cambridge, MA: O’Reilly. http://www.oreilly.com/catalog/opensources/book/toc.html.
Dourish, Paul, and Matthew Chalmers (1994). “Running Out of Space: Models of Information Navigation.” Presented at HCI 1994, Glasgow.
Fellbaum, Christiane (editor) (1998). WordNet: An Electronic Lexical Database. Cambridge, MA: The MIT Press.
Foucault, Michel (2000). “Discourse and Truth: the Problematization of Parrhesia.” In Fearless Speech, edited by Joseph Pearson. New York and Santa Monica: Semiotext(e)/Smart Art.
Gardner, Howard (1987). The Mind’s New Science: A History of the Cognitive Revolution. New York : Basic Books.
Garfield, E. (1979). Citation Indexing: Its Theory and Applications in Science, Technology and Humanities. New York: John Wiley.
Gladwin, Thomas (1964). “Culture and Logical Process.” In Explorations in Cultural Anthropology: Essays Presented to George Peter Murdock, edited by W. Goodenough. New York: McGraw-Hill.
Grefenstette, Gregory (1994). Explorations in Automatic Thesaurus Discovery. Boston: Kluwer Academic Publishers.
Hague, Barry N., and Brian D. Loader (editors) (1999). Digital Democracy: Discourse and Decision Making in the Information Age. New York: Routledge.
Harabagiu, Sanda, and Dan Moldovan (1999). “Enriching the WordNet Taxonomy with Contextual Knowledge Acquired from Text.” In Natural Language Processing and Knowledge Representation: Language for Knowledge and Knowledge for Language, edited by S. Shapiro and L. Iwanska. Cambridge, MA: AAAI/The MIT Press.
Hearst, Marti (1998). “Automated Discovery of WordNet Relations.” In WordNet: An Electronic Lexical Database, edited by Christiane Fellbaum. Cambridge, MA: The MIT Press.
Hutchby, Ian, and Robin Wooffitt (1998). Conversation Analysis: Principles, Practices, and Applications. Malden, MA: Polity Press.
Johnson, Lewis, and Elliot Soloway (1985). “PROUST: Knowledge-Based Program Understanding.” IEEE Transactions on Software Engineering, Vol.SE-11, no.3 (1985): 11-19.
Kuhn, Thomas (1996). The Structure of Scientific Revolutions. Chicago, IL : University of Chicago Press.
Lakoff, George, and Mark Johnson (1980). Metaphors We Live By. Chicago: University of Chicago Press.
Munro, Alan J., Kristina Hook and David Benyon (editors) (1999). Social Navigation of Information Space. London and New York: Springer Verlag.
Resnick, Paul, and Hal R. Varian (1997). “Introduction: Special Section on Recommender Systems.” In Communications of the ACM, 40, no.2 (March 1997).
Sack, Warren (1992). “Knowledge Compilation and the Language Design Game.” In Intelligent Tutoring Systems, Second International Conference (Lecture Notes in Computer Science), edited by Claude Frasson, Gilles Gauthier, and Gordon McCalla. Berlin: Springer-Verlag.
---. (2000a). “Discourse Diagrams: Interface Design for Very Large-Scale Conversations.” In Proceedings of the Hawaii International Conference on System Sciences), Persistent Conversations Track, Maui, January 2000.
---. (2000b). “Conversation Map: A Content-based Usenet Newsgroup Browser.” In Proceedings of the International Conference on Intelligent User Interfaces), New Orleans, January 2000.
---. (2000c). “Design for Very Large-Scale Conversations.” Ph.D. Thesis, MIT Media Laboratory, February 2000.
---., and Randy Bennett (1993). Method and System for Interactive Computer Science Testing, Analysis and Feedback. Patent number 5,259,766, issued Nov. 9, 1993.
---., and Joseph Dumit (1999). “Very Large-Scale Conversations and Illness-Based Social Movements.” Presented at Media in Transition, MIT, October, 1999.
Schiffrin, Deborah (1994). Approaches to Discourse. Cambridge, MA: Blackwell, 1994.
Sengers, Phoebe (2001). Critical Technical Practices web page. http://www-2.cs.cmu.edu/~phoebe/work/critical-technical-practices.html.
Smith, Marc (1997). “Netscan: Measuring and Mapping the Social Structure of Usenet.” Presented at the 17th Annual International Sunbelt Social Network Conference, San Diego, CA: February 13-16, 1997.
Turkle, Sherry (1984). The Second Self: Computers and the Human Spirit. New York: Simon and Schuster.
Varian, Hal, and Carl Shapiro (1999). Information Rules: A Strategic Guide to the Network Economy. Cambridge, MA: Harvard Business School Press.
Suchman, Lucy (1987). Plans and Situated Actions: The Problem of Human-Machine Communication. Cambridge: Cambridge University Press.
Tsagarousianou, Roza, Damian Tambini and Cathy Bryan (editors) (1998). Cyberdemocracy: Technology, Cities and Civic Networks. New York: Routledge.
Wardrip-Fruin, Noah, and Brion Moss (2001). “The Impermanence Agent: Project and Context.” In Cybertext Yearbook 2001, edited by Markku Eskelinen and Raine Koskimaa. Saarijärvi: Publications of the Research Centre for Contemporary Culture, University of Jyväskylä.
Wasserman, Stanley, and Joseph Galaskiewicz (editors) (1994). Advances in Social Network Analysis: Research in the Social and Behavioral Sciences. Thousand Oaks, CA: Sage Publications.
Wellman, Barry (1999). “Living Networked in a Wired World.” IEEE Intelligent Systems 14, no.1 (January/February 1999): 15-17.
Wittgenstein, Ludwig (1958). The Blue and Brown Books. New York: Harper and Row.
Cite this article
Sack, Warren. "What Does a Very Large-Scale Conversation Look Like?" Electronic Book Review, 7 March 2005, https://electronicbookreview.com/publications/what-does-a-very-large-scale-conversation-look-like/